
NOTE: This post was from 2014. This workshop already happened. Keep reading if you want to know a bit more about graphical solutions in physics.
Graphical Solutions for Forces and Kinematics
On the Sunday of the AAPT summer meeting (July 27th), Casey Rutherford and I are offering a free, unofficial1 workshop on using velocity graphs and force vector addition diagrams to solve kinematics and force problems. I was really lucky to get to also work with Mike Pustie earlier this month to give a similar workshop for the STEM Teachers NYC (née PhysicsTeachersNYC) group.
Our hope is to show how our students use these diagrams as sense-making tools to solve problems, to give you time to try using them yourself, and to show how and why we’ve found them useful for physics students. These strategies can be more accessible for students who have less experience or confidence with math while also allowing for more subtlety, depth, and original thinking for students who have more math confidence and/or experience, so we think that teachers in a wide range of schools/classes/etc might find something useful in this workshop.
You can find more details about the July workshop including our description, the location, and the sign-up form on our workshop website.
And now, to make this a legit blog post, here’s a preview of the content:
Solving Kinematics Problems with Velocity-Time Graphs
In my observations, the kinematics equations can be a big stumbling block for intro physics students for a couple of reasons. (1) Solving problems with these equations means keeping careful track of algebra and dealing with a lot of symbols at once. (2) The procedure that many students adopt in using equations for kinematics often separates that work from making sense of physical situations. In that case, students may just be hunting for equations with the symbols they want and not doing a lot of (what I would call) real physics thinking.
Enter the velocity graph. (My favorite graph, as my students might tell you. It’s just so useful! The slope and the area both mean things, and (in intro physics) it’s usually a straight line, so the area is made up of rectangles, triangles, or trapezoids—all areas I can find easily.) With this approach, students always start problems in the same sort of way (making for a comfortable-to-students procedural-type feel)—they draw and annotate graphs that represent the situation. They immediately make decisions on what model is useful, direction of motion, how the speed is changing, etc. Their work is all about sense-making.
Here’s a taste of what it looks like when real life students solve problems this way. (Note, the “Yay!” is the student’s—she wrote it while looking over the solutions when she turned in the quiz.)
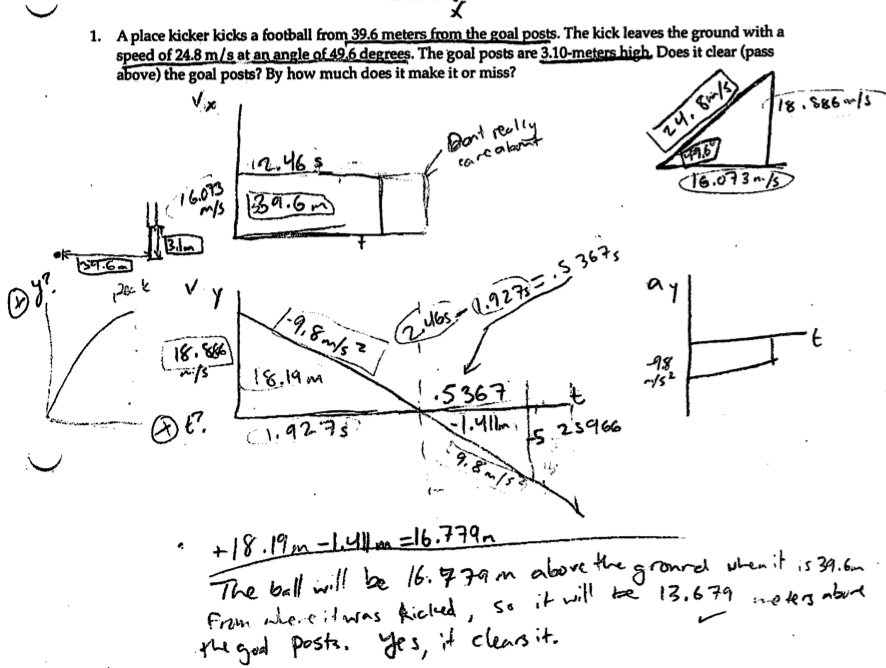
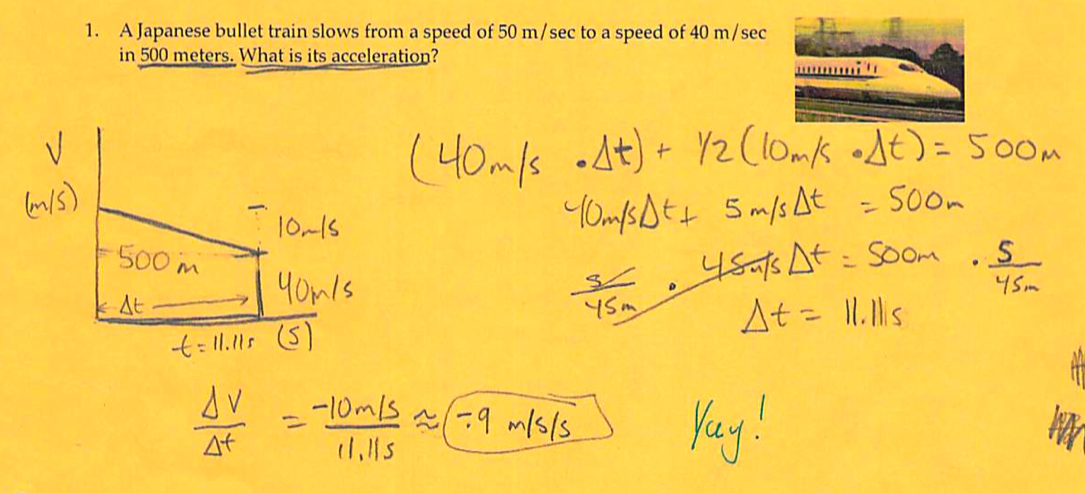
On the one hand, solving problems this way gives students who struggle with algebra, keeping track of signs, and remembering equations better access to solving quantitative motion problems at any difficulty level. On the other hand, it makes the connection to calculus really clear for students (they come back in subsequent years to exclaim that they are basically generalizing in math what they’ve done in physics—they leave the class with a real appreciation for the meaning of slopes and areas on graphs)—I see their work as being more mathematically sophisticated than it seemed to me when I was teaching students kinematic equations.
Here are a couple of old, related posts: On Annotating Graphs | On Students Noticing Patterns (Equations)
Solving Force Problems with Vector Addition Diagrams
When it comes to procedural solutions that can allow students to move through problems without necessarily making physical sense of the solution, Newton’s 2nd Law in component form was a major offender in my classroom. Students were often bogged down in trigonometry (which they might not have even understood because they hadn’t gotten that far in their math classes yet) or sign problems or lining up the correct parts of the equation in just the way I had told them to write it. Every “good solution” to a problem basically looked identical, so there was (sometimes) little of a student’s own creativity or sense-making needed.
I found vector addition diagrams really compelling when I first encountered them, and I started showing them to students as an additional representation. Eventually, I started teaching balanced forces this way (and delaying components until unbalanced forces when students might be more comfortable with trig). And finally, students convinced me that this method was better and told me to stop teaching components. (Never fear—the idea of components comes up naturally for students as they analyze their diagrams, so they don’t really miss out on that concept, and they are ready to break velocity into parts when they study projectile motion.)
I only teach my students to draw vector diagrams to scale (if they are using them quantitatively—they always start with a qualitative sketch anyway). As they learn more math, they start seeing how they can apply trig ideas to their physics work and transition as they are ready. I can always tell when they’ve just learned law of sines (they are always so in love with that idea that they try to use it for everything, even right triangles, as soon as they’ve learned it). There is a lot of ownership and joy from students when they are deciding how to solve each geometric problem.
And again, here’s some delicious student work on force problems.
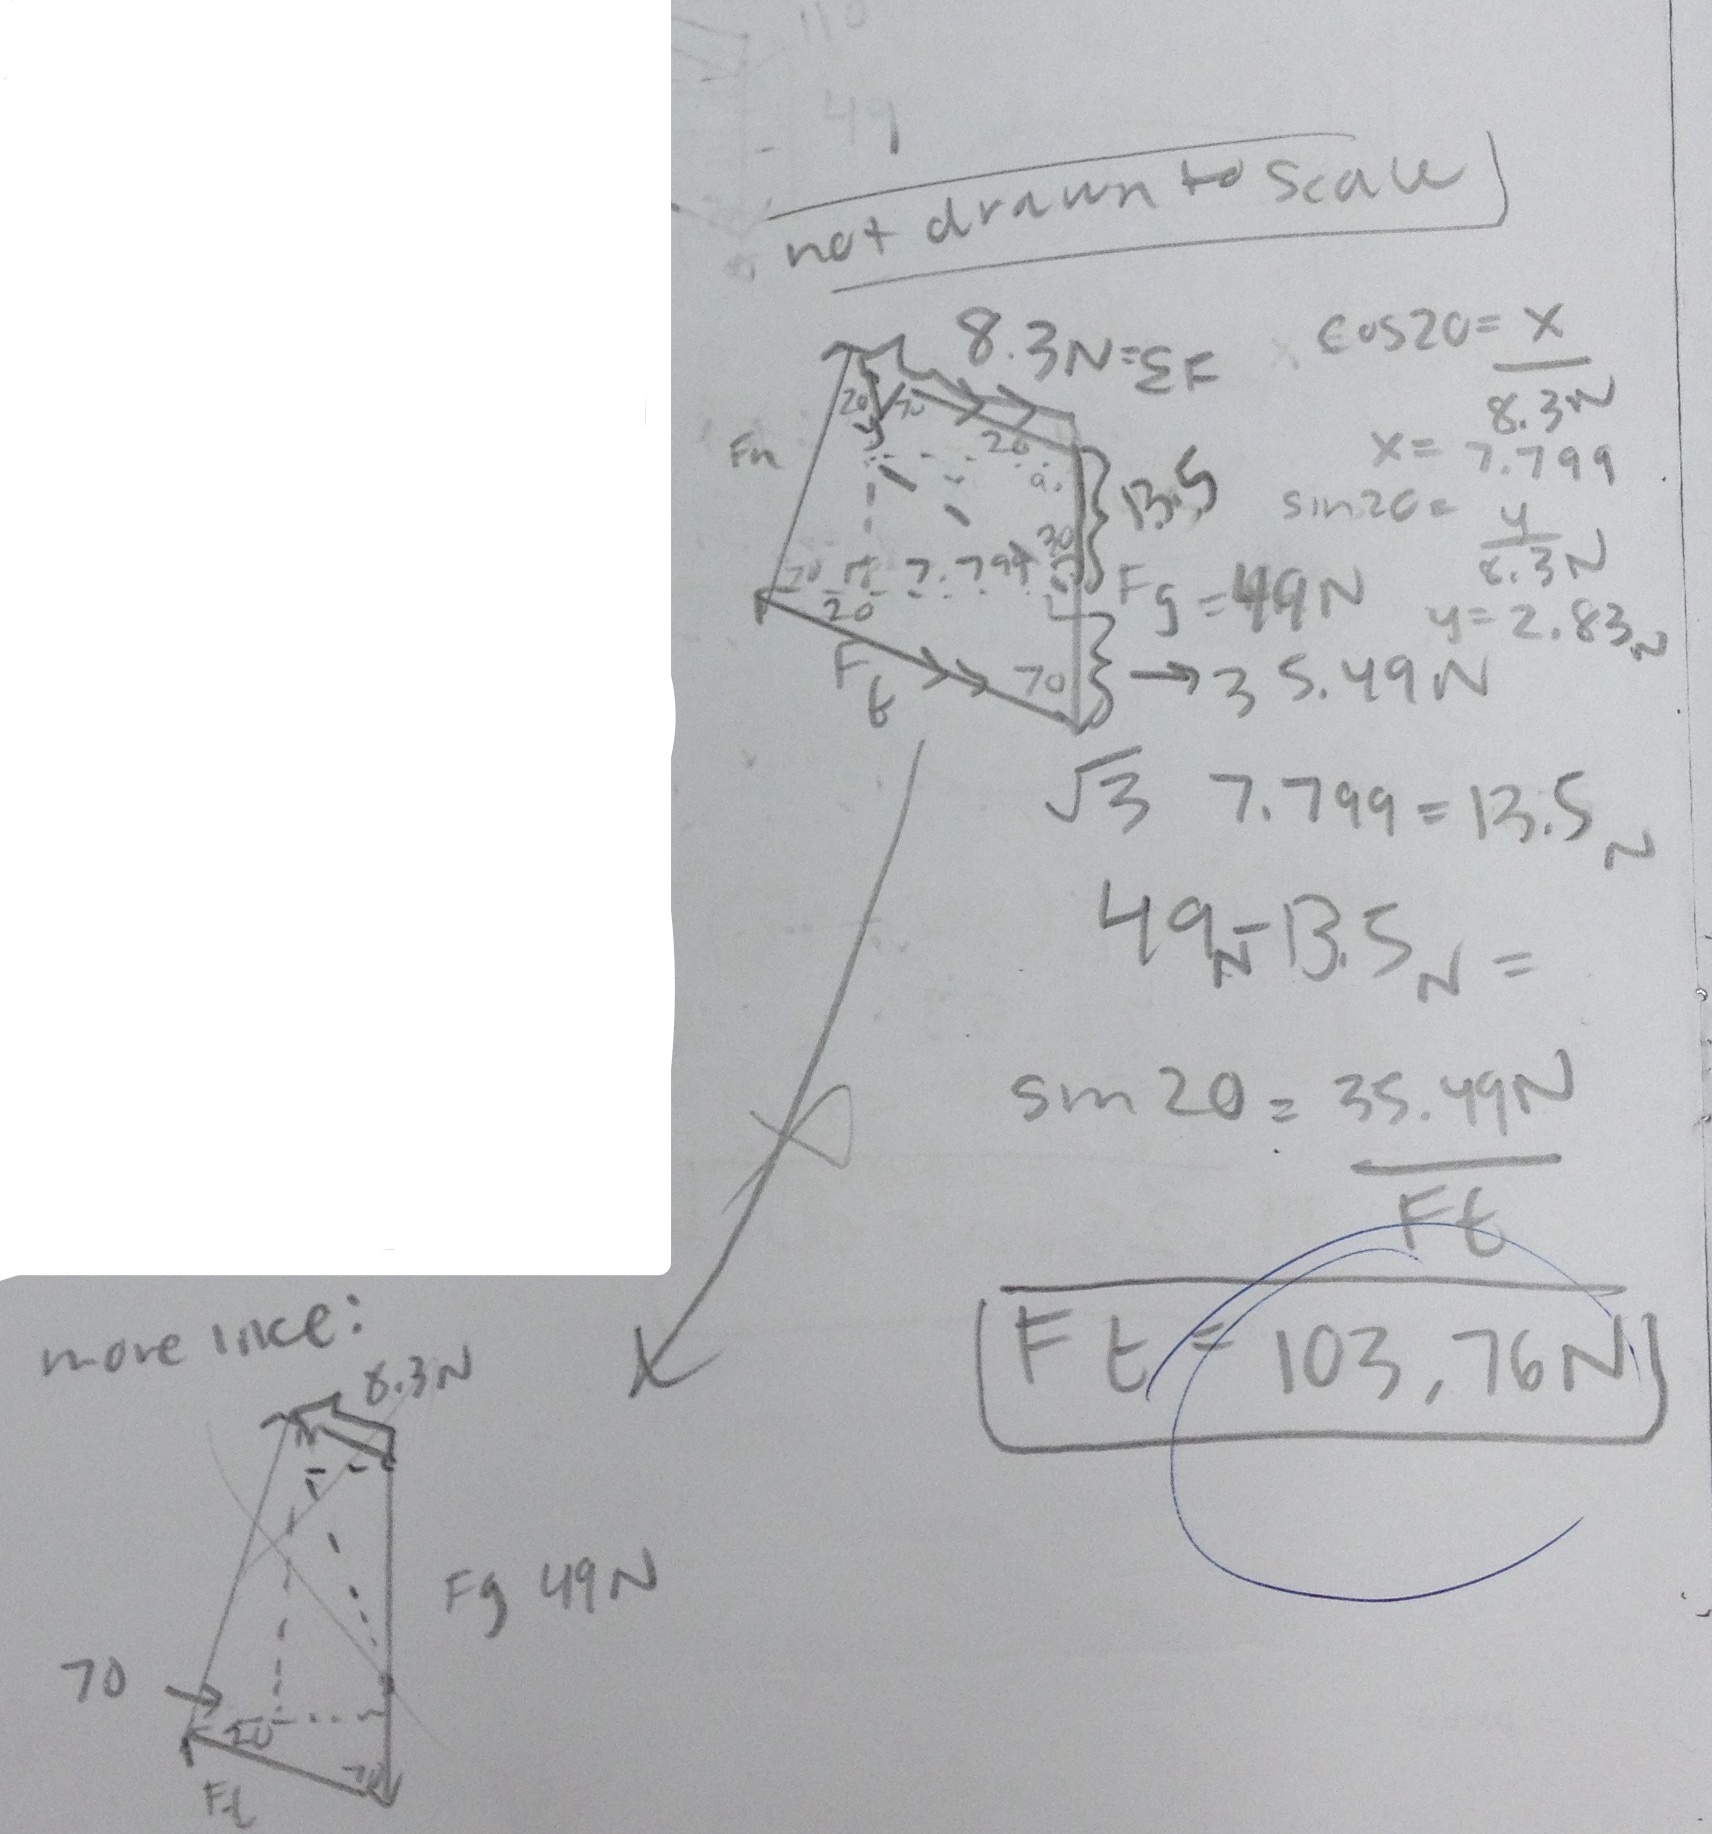
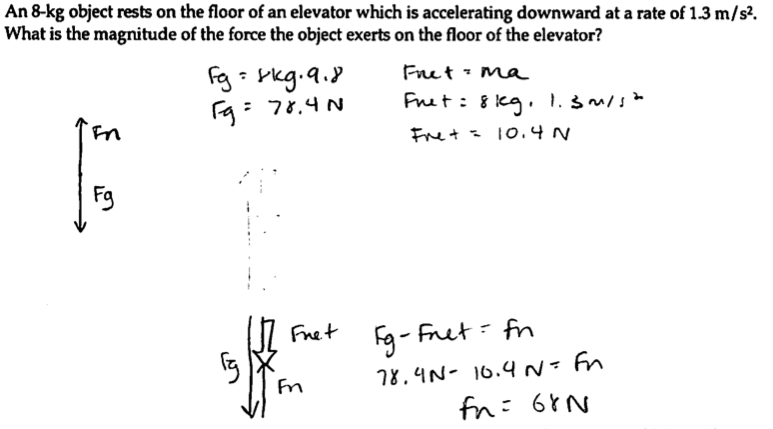
I think you can see from even just these three examples that this method allows for a diversity of approaches, that students are thinking about relative sizes of forces, and that students do end up inventing their own ideas about components in the context of the problem. Love it!
Here’s an old, relevant post: No More Components
Sign up
If you will be in Minnesota for AAPT this summer and would like to join us for the workshop, please fill out the form on our website to let us know and to reserve a spot. Casey and I are excited to share this work with you! (Click the sign up button to go to the workshop website.)

—
1 Casey and I started planning this workshop many months ago (January at least, but maybe earlier). Unfortunately, we didn’t understand how to get an official workshop and later found out we would have had to request that at least a year(!) in advance and not the several months in advance when the contributed talks are due as we’d thought—we asked if we could be added to the schedule once we realized that, but we were told it was too late for this year. We didn’t want to wait over a year to share what we’d been doing with students (and a 10 minute contributed talk wouldn’t have accomplished the same sort of sharing), so we decided to go the unofficial route for this year. So worry not—we didn’t set out to be especially subversive, and we plan to participate in many other, more official, AAPT events at the conference.


Sounds great, I’m sorry I won’t be arriving until about the time you are done 😦
Bummer! I’m hoping to offer it at least one more time again in the future. And I’ll have another post here with the resources (presentation, problem sets, etc) later this summer.
I’m sure there are many teachers like myself interested in what you are doing that will not be at the workshop. It would be great if you could make a video of your workshop available on your blog or the AMTA site (or youtube).
I don’t think there will be a video, but I’ll make another post with the resources we used sometime later this summer. And hopefully we will offer it again in the future.
I think I’m still an old school physics teacher. I like your idea of solving with graphs, but I find those solutions very difficult to follow. No arrows for vectors to define direction, little notation for numbers. It just looks like a bunch of numbers to me, with an answer circled at the bottom. Do you expect more notation in their answers? Or more formulas/relationships shown? (why numbers are being added) Mathematically, there are some bad rows of equal signs (3rd example).
I am always preaching that it is more than getting the answer – communicating with notation and formulas is as important. How do you balance that?
Thank you for commenting—these are great notes and questions. I will try to respond to each point.
1) No arrows for vectors—this one I’m a little confused about. All of the vectors are drawn as arrows above—I’m not sure I’m seeing what you’re talking about. Can you elaborate? (Ah, going back, the one place I saw it was in the first solutions when she is breaking a velocity vector into components—I don’t care as much there when they are looking at a single vector, but I do care a lot when they are dealing with many vectors added together (as in the force problems).)
2) Little notation, work with answer circled—I think that varies a lot across the examples (from a different students in different years). I do expect a lot from them in terms of showing their work. The kinematics ones look great to me, and the force ones at the bottom are pretty good (but could use more units). The one with the rectangle cut out is a bit of a mess, but I included it for a different reason (which I’ll talk more about below). It’s worth noting also that these are all from 10th graders and that the expectations (and results) were definitely much higher for my 12th graders. In general, I expect them to keep units with numbers and for their work to be clearly connected to their diagrams. As students become more confident, I nudge them to start with a line of symbols first, but that’s a place that seems to differentiate naturally for me (with students who aren’t ready for keeping track of so many symbols using numbers more concretely but still doing really significant physics thinking and solving). For me, the reason numbers are added together should be clear on the diagram (for 10th graders) and clear on both the diagram and in symbols (for 12th graders), but that’s just where I’ve been setting my expectations for my classes. I really think all the physics happens on the diagram (including the annotations there), so I deal with the trig/algebra/etc part of it in a looser way.
3) I also really poke at them over using equals signs correctly. The one thing I saw was in the one with the rectangle cut out—the root 3 is supposed to be multiplied by the 7.799 N on that one line, making the statement less “sketchy”, but still not how I’d prefer they use the equals sign (I’d rather the result be on the next line). That example is a little tougher to follow because I cut out a lot of the page (it was a big problem that also included a kinematics component) and because it was on the exam so she was a bit time-crunched (and so I tend to be a bit more forgiving when they don’t have time to go back and make things a little clearer). I wanted to include it anyway because of the two drawings she made of the vector addition diagram. I love that she included the one that looks more to scale (still a sketch though). That’s not an objective or requirement of mine, so she did it because she found it helpful, which I love. It also shows (I think) that she is really using the diagrams in two ways—both as a way to set up equations and solve for forces mathematically and also really as a tool for thinking about how the forces are related to each other (otherwise why draw the one that “looks better” if not to check for yourself that this makes sense?).
4) I’m right there with you on the answer not being the really important part (as I tell them, I already know all these answers—I’m looking to see how you think about it. Of course getting the right answer is part of thinking about it correctly, but it can’t tell me everything.). To me, because the diagrams are sense-making tools, their thought process is much clearer to me when they use them (even if the work doesn’t always look textbook or clean or algebraic)—I know they aren’t following a procedure without understanding it because they have to think about relationships and physical meaning to set up the diagrams. It’s definitely a different way of looking at and for their thinking, though! 🙂
And of course, I should note that I don’t mean to imply here that this is the best or only right way for students to do these kinds of problems. It’s been really useful for me, which is why I’m eager to share it, but we each have to find what works well for our own students and classes (and those populations, personalities, cultures, etc can vary so much!). I hope I’ve been helpful in clarifying—please ask more questions (especially if I haven’t been clear enough)! 🙂
I am a student research assistant at Montana Tech of the University of Montana. Technology has created exciting ways to connect with others and form professional learning networks. As a part of an active member of a social media community made up of teachers, I wanted to contact you to ask you to participate in a study our research group is conducting.
Research shows that face-to-face professional networks provide much needed professional and personal support to teachers. You and the community you belong to are providing these types of support using social media. We are interested in learning more about your experiences using social media to connect with other teachers and your opinions about online professional networks.
The purpose of our study is to learn how professional learning networks created through social media are similar or different than face-to-face networks and what you feel are advantages of using social media to connect with other teachers. Our hope is that the results of this study will inform how professional networks for teachers are designed in the future. If you are interested in participating, please send an email to me at teacherblogPLN@gmail.com. I will send you a link to a short online survey and will set up time for a short skype interview.
If you have any questions you would like to ask about the study, please do not hesitate to contact me.
Sincerely,
Kaitlyn Rudy
Research Assistant
Department of Mathematical Sciences
Montana Tech of the University of Montana
Kelly,
Would you consider doing an official modeling workshop in NJ next summer? I know STEMTeachersNYC runs a program, but that’s not accessible to everyone this side of the Hudson and as there are no workshops (this year at least) in NJ, you’d be pick up a new population of teachers. I’m sure NJAAPT would help spread the word. I teach at Morristown High School, which is pretty central to the state and right off several major highways, and I would be more than happy to help you host it here.
I also think that modeling should be a part of the New Jersey Science Teacher Convention next year. I am presenting this year on both Nanoscale Science and also Freshman Physics, and I will speak with the coordinators about the potential for a modeling workshop or info session at the 2015 convention.
Do you know any master teachers in modeling instruction who are more local to me and might want to participate in either a summer workshop or at the convention?
Best,
Mariel Kolker
Physics, Nanoscale Science, PLTW Engineering teacher
Morristown High School
[…] good handle on velocity vs. time graphs, they took their first stab at solving problems using graphical solutions. By the end of the hour, most students seemed pretty comfortable with this approach. I’m sure […]